San Diego County had 5,841 active listings in August 2026, according to the FRED series that tracks Realtor.com data. That’s still thin by historical standards, and SDMLS figures point to roughly a few months’ supply county-wide, a level that keeps most detached-home negotiations tilted toward sellers even as condo inventory loosens. If you’re buying, expect competition on move-in-ready homes under $900,000. If you’re selling, price accuracy matters more than ever.
TL;DR:
- San Diego County’s active home listings stood at 5,841 in August 2026, with supply primarily favoring sellers for detached homes, especially under $900,000.
- The market shows a divergence: detached-home inventory remains historically low, while condo and townhome listings have increased beyond seasonal norms.
- Current supply in detached homes is estimated at just a few months, favoring sellers, whereas condos and attached housing have closer to balanced levels with more negotiation room.
- Mortgage rates and seasonal patterns are key drivers, with detached home prices remaining high despite slower sales, and condo inventory growing as demand shifts.
- Buyers should prioritize condos for negotiation leverage, while sellers should time listings when detached inventory is seasonally low for maximum advantage.
Table of Contents
- What Is the Current Housing Inventory in San Diego?
- How Is Months of Supply Calculated?
- Are Housing Prices Dropping in San Diego County?
- Where Can You Track Live Housing Data Yourself?
- Comparing San Diego Housing Providers by Service and Reviews
- What Should Buyers and Sellers Do With This Inventory Data?
- How Does San Diego Compare to Los Angeles and Orange County?
- What Has San Diego’s Housing Inventory Looked Like Over the Past Decade?
- Do Seasonal Patterns Affect San Diego’s Housing Inventory?
- Ryan Case’s Take on Where San Diego Inventory Is Headed
- Ready to List While Detached Inventory Stays Tight?
- Sources
- FAQ
What Is the Current Housing Inventory in San Diego?
The most recent monthly figure from FRED’s active listing series for San Diego County puts active inventory at 5,841 homes for August 2026. That number comes from Realtor.com’s data feed and updates once a month, so it’s the best source for spotting the big-picture trend rather than day-to-day shifts.
For a faster read, SDMLS market stats track new listings and current inventory weekly, which is closer to what agents actually watch when advising clients on timing. Redfin’s San Diego market page adds median list price and a competition score, useful for gauging how hot a specific price band or zip code has gotten.
Here’s the snapshot as it stands:
- Active listings (county-wide): 5,841 as of August 2026, per FRED/Realtor.com
- Data cadence: FRED updates monthly; SDMLS and Redfin refresh weekly or near-real-time
- Coverage note: Active listing counts typically include single-family and condo properties but exclude homes already in pending or under-contract status
- Median list price: Tracked continuously on Redfin’s San Diego page, useful for cross-checking against the inventory count
Pro Tip: Don’t rely on a single source. FRED gives you the historical shape of the market, but SDMLS and Redfin catch shifts FRED won’t show for another month.
How Is Months of Supply Calculated?
Months of supply is the metric that turns a raw listing count into something meaningful for timing a purchase or sale. The math is simple, but the inputs matter.
- Numerator: current active listings (the FRED or SDMLS count for the month)
- Denominator: average monthly home sales (closed transactions) over a recent period, usually three to six months
- Divide the two. If San Diego has roughly 5,841 active listings and average monthly sales run near 2,000 to 2,500, supply lands somewhere around a few months.
- Active vs. pending distinction: “Active” means still on the market and accepting offers. Pending and under-contract homes are excluded, which is why active counts can look low even when total sales activity is strong.
As a rule of thumb, less than several months of supply favors sellers, three to six months is balanced, and above six months tips leverage toward buyers. San Diego has sat in seller-favoring or balanced territory for most of the past two years, per the trend visualized on SDHousingMarket’s weeks-of-supply tracker.
Are Housing Prices Dropping in San Diego County?
Not uniformly, and that’s the part most headlines miss. The Rennie Advance report for September 2026 found that August 2026 logged one of the quietest sales paces in recent years, yet detached-home prices hit record highs during the same stretch. Slower sales and record prices sound contradictory until you look at what’s actually selling.
Detached homes stayed tight enough that sellers with well-priced properties kept commanding top dollar. Condos and townhomes told a different story: inventory in that segment climbed above typical seasonal norms, according to the same Rennie report, giving buyers more room to negotiate on attached housing than on single-family homes.
A few forces are driving this split:
- Mortgage rates are keeping would-be move-up sellers on the sidelines, which limits how many detached homes hit the market
- Buyer demand pullback shows up more in the condo segment, where affordability-driven buyers are more rate-sensitive
- Investor activity has cooled slightly, adding to condo inventory as fewer units get absorbed quickly
- Seasonal listing patterns typically bring a late-summer slowdown, which the 2026 data reflects almost exactly
Zoom out to twelve months and the pattern holds: detached supply has stayed structurally low while attached housing has drifted toward balanced conditions. Norada Real Estate’s market commentary echoes this divergence, framing San Diego as two markets moving on different clocks depending on property type.
Where Can You Track Live Housing Data Yourself?
You don’t need a subscription or an agent’s login to watch San Diego inventory in real time. Three sources cover nearly everything a buyer or seller needs, each suited to a different rhythm.
- FRED’s active listing series: Best for historical context and month-over-month comparisons. Sourced from Realtor.com and detailed further on Realtor.
- SDMLS market stats: The closest thing to ground truth for local agents, updated weekly with new listings and current counts.
Pro Tip: Check FRED once a month for the big picture, then glance at SDMLS or Redfin weekly if you’re actively watching a specific price band. Setting a recurring calendar reminder beats refreshing the page daily.
Comparing San Diego Housing Providers by Service and Reviews
San Diego’s inventory conditions call for different specialists depending on whether you’re renting out a property, selling a mobile home, offloading a distressed asset, or listing a standard single-family house. Reviews and ratings matter, but service fit matters more.
Two questions narrow this list fast. First, does the provider actually specialize in your property type. A mobile-home dealer and a multifamily broker aren’t interchangeable, no matter how good either one’s reviews look. Second, does their scale match your situation. A large operation like Utopia handles volume well for rental portfolios, while a smaller, specialized shop tends to give more individual attention on a single transaction.
What Should Buyers and Sellers Do With This Inventory Data?
The numbers only matter if they change what you do next.
- Sellers: Price against active comparable listings, not last year’s closed sales. Prioritize professional marketing on well-photographed detached homes, since that segment is still tight enough to reward strong presentation.
- Sellers: Time your listing around seasonal inventory dips rather than fighting a spring flood of new competition. Review seller closing costs early so your net proceeds target is realistic.
- Buyers: Widen your search radius if you’re shopping detached homes less than several months of supply. Build offer flexibility, including appraisal and inspection terms, since competitive segments punish rigid buyers.
- Buyers: Watch the condo segment for negotiating room. Rising inventory there means more leverage on price and concessions than detached listings currently allow.
Pro Tip for sellers: List when detached inventory is seasonally low, typically late winter into early spring, to maximize buyer competition. Pro Tip for buyers: Target condos and townhomes first if speed and price flexibility matter more than square footage.
How Does San Diego Compare to Los Angeles and Orange County?
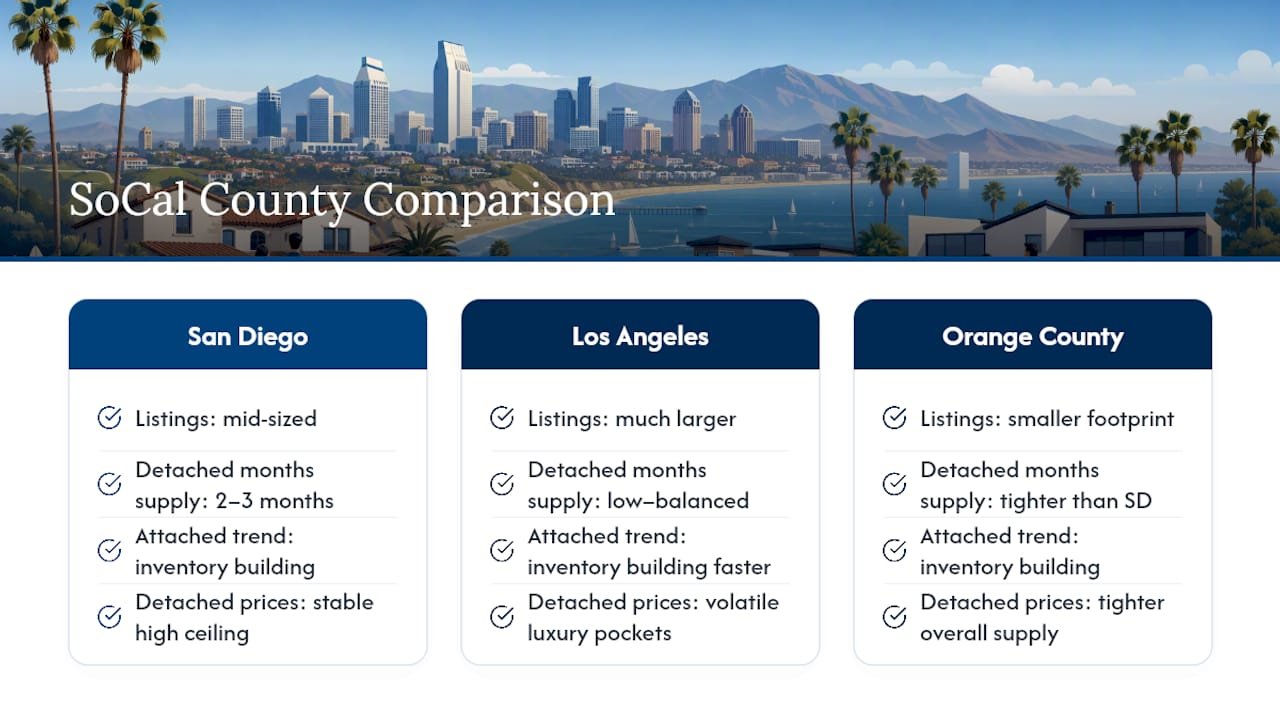
San Diego’s inventory squeeze isn’t unique to the county, but the degree differs from its neighbors. Los Angeles County carries a much larger absolute listing count simply due to population size, yet its months of supply has tracked in a similar low-to-balanced range for detached homes, driven by the same rate-lock effect keeping move-up sellers in place.
Orange County tends to run tighter than San Diego on a percentage basis. Its smaller geographic footprint and higher median price point concentrate demand into a narrower supply base, often pushing months of supply below San Diego’s current two to three month range during active selling seasons.
The common thread across all three Southern California counties is the detached versus attached divergence. Condo and townhome inventory has been building faster than single-family supply in Los Angeles and Orange County too, mirroring the pattern the Rennie Advance documented for San Diego. Investors and first-time buyers priced out of detached homes in all three markets are leaning on attached housing, which is precisely why that segment carries more inventory and more negotiating room right now.
What sets San Diego apart is the relative stability of its detached-home price ceiling. Where Los Angeles has pockets of sharper volatility tied to luxury segments and Orange County shows tighter overall supply, San Diego’s record detached prices during a historically slow sales month suggest a market absorbing higher rates without cracking on price, at least for single-family housing.
What Has San Diego’s Housing Inventory Looked Like Over the Past Decade?
San Diego’s inventory story over the last several years has been one of steady tightening followed by a partial, uneven recovery. Active listings ran considerably higher in the years before 2020, when more move-up sellers were willing to list without fear of trading a low mortgage rate for a much higher one.
The pandemic-era rate drop that started in 2020 pulled inventory down sharply as buyer demand spiked and sellers who already owned homes had little incentive to sell into a market where replacement financing was still cheap. That dynamic reversed only partially once rates climbed back up: rather than freeing up inventory, higher rates locked many existing owners into their current mortgages, keeping detached supply structurally lower than pre-2020 norms.
What’s different in 2026 is the segment split described earlier. Detached inventory remains historically constrained, similar to the tightest years of the past decade, while condo and townhome supply has crept upward toward levels not seen since before the pandemic. This is a meaningful shift from the uniform tightness of 2021 and 2022, when nearly every property type in San Diego was scarce.
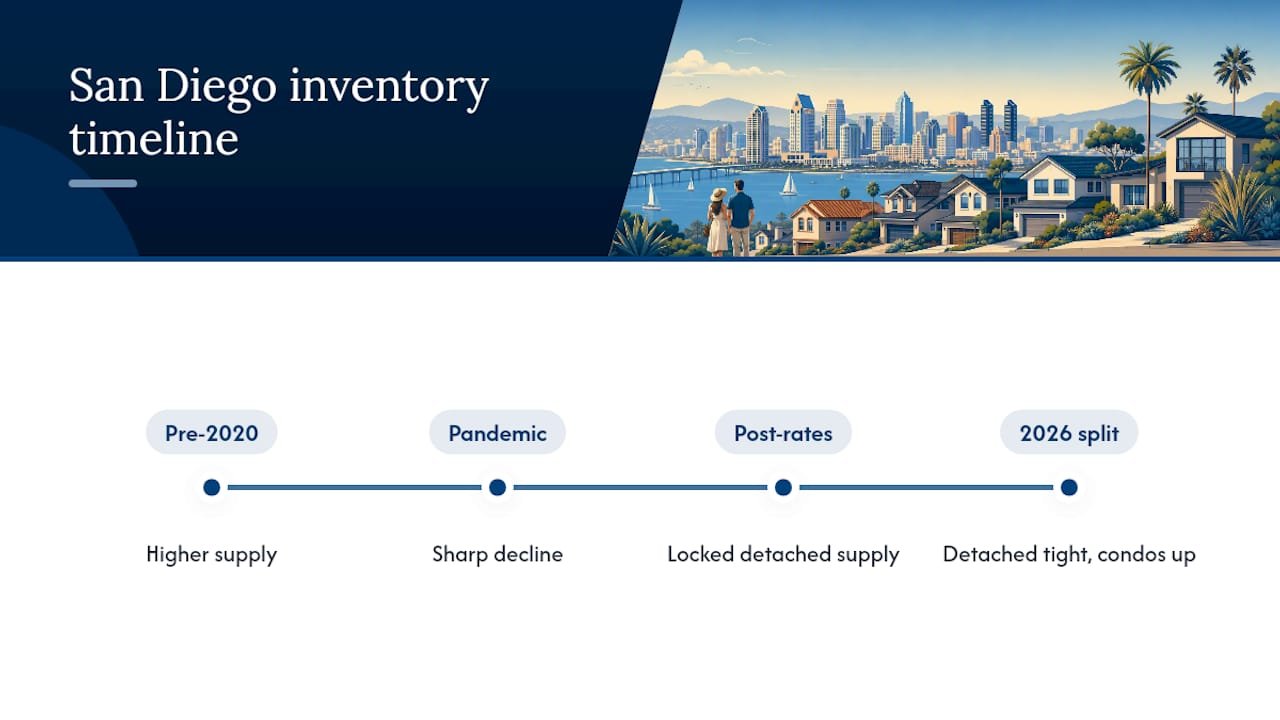
The takeaway for anyone comparing today’s 5,841 active listings against memory of a “normal” San Diego market: there hasn’t been one normal market for the whole county. Detached and attached housing have effectively decoupled, and any historical comparison needs to account for which segment you’re actually looking at.
Do Seasonal Patterns Affect San Diego’s Housing Inventory?
Yes, and the swings are predictable enough to plan around. San Diego listings typically build through late winter and spring, peak around early to mid summer, then taper into fall and bottom out over the holidays. That rhythm held again in 2026, with the Rennie Advance noting the slowest sales pace in over a decade arriving in August, a month that often marks the start of the seasonal cool-down rather than an anomaly.
Sellers who list in January or February often face less competition from other sellers but also a smaller pool of active buyers still settling in from the holidays. By April and May, both buyer activity and new listings ramp up together, which is why spring remains the highest-volume season for transactions even though it’s not necessarily the lowest-inventory window.
Fall and winter bring the opposite tradeoff: fewer new listings hit the market, which can work in a seller’s favor if buyer demand holds up, but overall transaction volume drops, meaning a listing might sit longer even with less competition. Investors and cash buyers, including firms like CT Homes, LLC, sometimes use this quieter window to negotiate more aggressively on distressed or as-is properties, since fewer buyers are actively shopping.
Understanding this cycle matters more this year because the detached-condo divergence adds a second layer on top of normal seasonality. A condo seller listing in the fall faces both the typical seasonal slowdown and a segment that already has more competing inventory than usual.
Ryan Case’s Take on Where San Diego Inventory Is Headed
Don’t read the detached-condo split as a temporary blip. It reflects two genuinely different buyer pools reacting to the same rate environment in opposite ways, and I expect that gap to persist through the next several reporting cycles rather than close quickly.
If you’re selling a detached home, this is your moment to price with confidence rather than defensively. I’ve laid out where I think both segments head next in my San Diego market forecast. This month, get your comparable sales pulled and your listing photos scheduled before fall inventory shifts again.
— Ryan Case
Ready to List While Detached Inventory Stays Tight?
Detached-home sellers in San Diego are working with real leverage right now, but leverage only pays off with sharp pricing and marketing that reaches serious buyers fast. That’s the gap the Premier Selling System is designed to address: strategic pricing using current market data, combined with targeted exposure through tools like Zillow Showcase and access to a broad buyer network.

If your home needs work before it hits the market, or you’d rather skip repairs entirely, selling as-is in San Diego is worth a look too. Either way, the next step is the same: get a personalized read on where your specific property sits against current inventory. Start with a home analysis from Ryan Case and find out what your listing timeline should actually look like.
Sources
- Housing Inventory: Active Listing Count in San Diego County, CA (ACTLISCOU6073) | FRED
- Market Stats | SDMLS
- The San Diego Rennie Advance — September 2026
FAQ
What Is the Current Housing Inventory in San Diego?
San Diego County had about 5,841 active listings as of August 2026, according to FRED’s Realtor.com sourced series, with weekly updates available through SDMLS.
Are Housing Prices Dropping in San Diego County?
Not across the board. Detached-home prices hit high levels in August 2026 even as overall sales pace slowed, while condo and townhome prices have softened somewhat as that segment’s inventory has grown, per the Rennie Advance report.
How Many Months of Housing Inventory Is Normal?
A balanced market typically runs three to six months of supply. San Diego has generally sat below that range for detached homes, around a few months, which keeps conditions favorable for sellers of single-family properties.
What Are the Current Housing Trends in San Diego County?
Detached-home inventory is staying tight while condo and townhome inventory has climbed above typical seasonal levels, a divergence tied to mortgage rate lock-in and shifting investor activity described in the Rennie Advance.
How Can I Find Current Homes for Sale in San Diego?
Check SDMLS for MLS-level counts and new listings, Redfin’s San Diego page for interactive neighborhood data, or work with a local agent like Ryan Case for listings matched to your specific criteria.